Moving Averages – A Trusted Best Indicator for Forex Trading
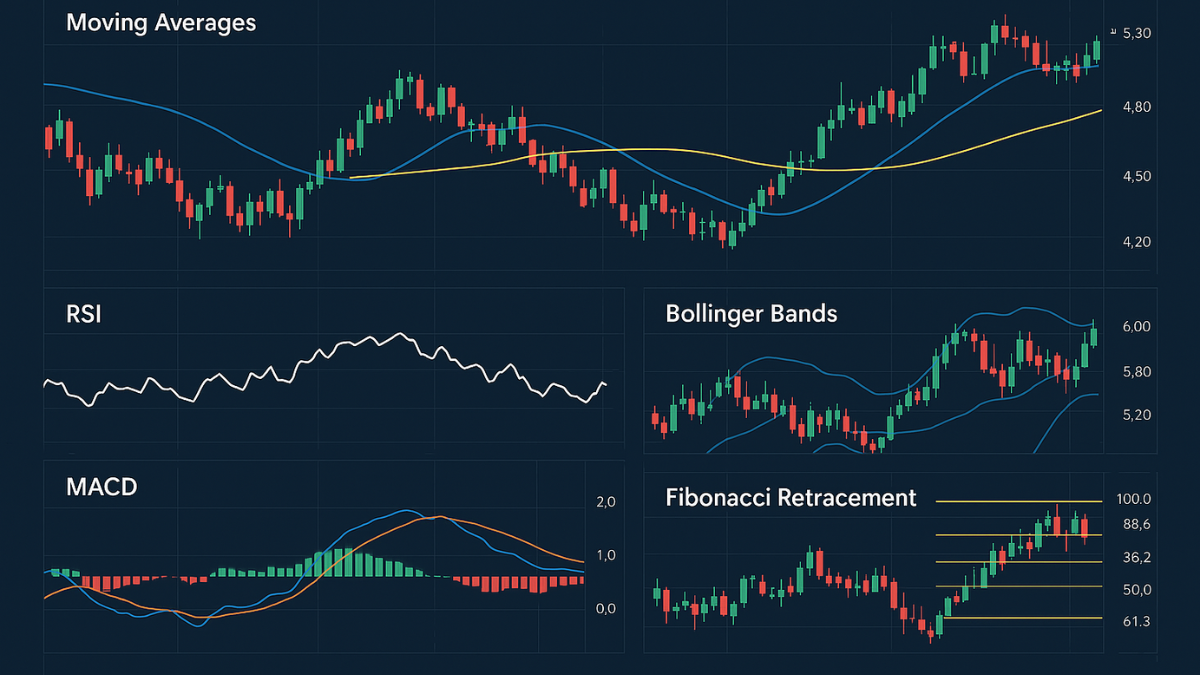
If you’re new to the forex world, there’s one tool almost every trader starts with: the Moving Average. It’s often ranked as the best indicator for forex trading because of how simple and effective it is. A Moving Average (MA) helps smooth out the noise of price fluctuations and gives a clearer view of the market trend. Whether the market is trending up, down, or moving sideways, MA helps confirm the overall direction.
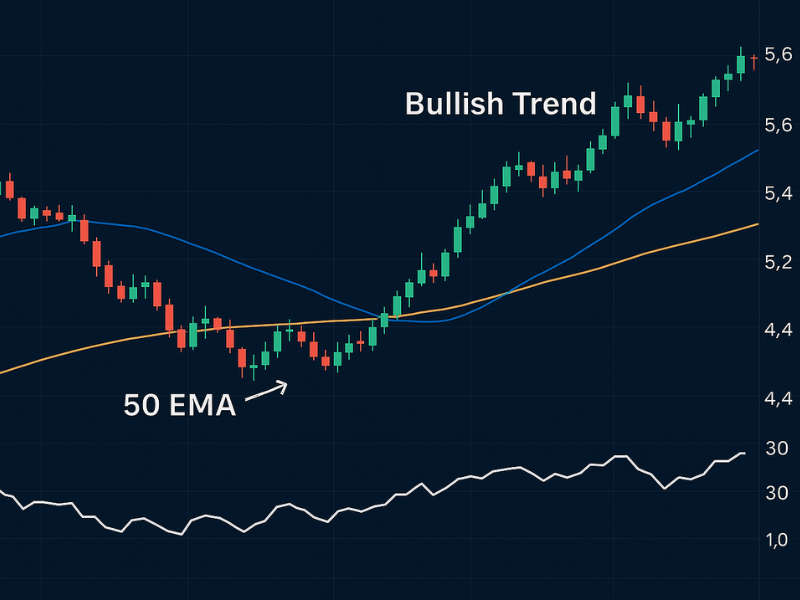
There are two popular types: Simple Moving Average (SMA) and Exponential Moving Average (EMA). SMA takes the average closing price over a certain period, while EMA gives more weight to recent prices—making it more responsive. Most traders use MAs like the 50-day and 200-day as dynamic support and resistance levels. A crossover of these averages often signals a buy or sell opportunity. That’s why many professionals still rely on MAs as their best indicator for forex trading in any market condition.
Also Read: Best Cryptocurrency to Invest Today
RSI – A Leading Forex Trading Indicator for Reversals
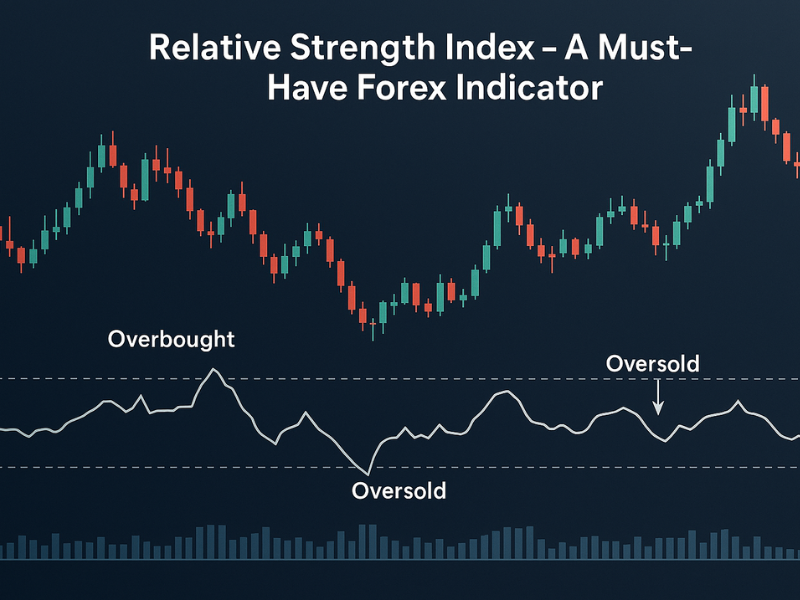
The Relative Strength Index (RSI) is a powerful momentum oscillator that tells you when a market might reverse. It moves between 0 and 100, and traders typically look for signals when the indicator goes above 70 (overbought) or below 30 (oversold). These levels often signal that the price could reverse soon, giving traders an edge in timing their entries and exits.
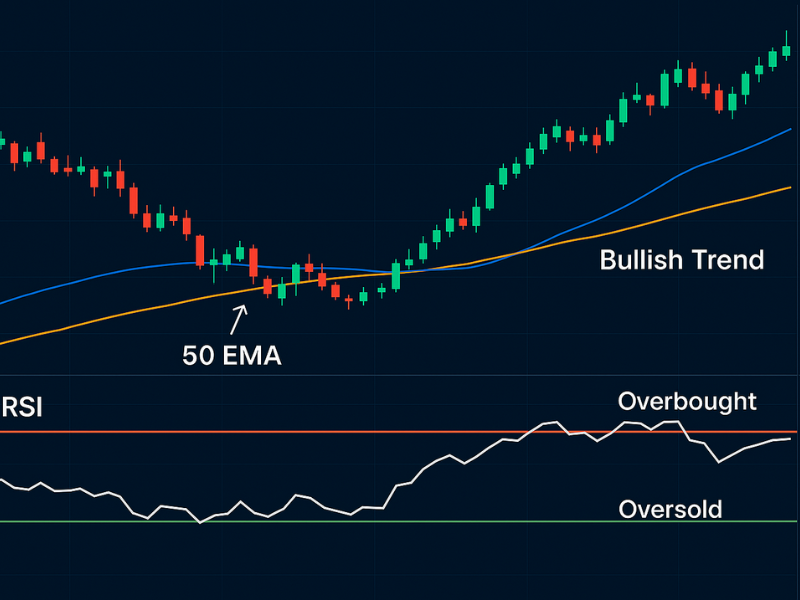
What makes RSI a contender for the best indicator for forex trading is its ability to keep traders from buying at the top or selling at the bottom. In trending markets, RSI can also help identify “hidden divergences”—where price makes new highs or lows but RSI does not—hinting at a potential trend shift. When used with other tools like Moving Averages or trendlines, RSI becomes even more powerful. Its simplicity, visual clarity, and high accuracy in ranging conditions make it a go-to tool for traders worldwide.
Also Read: Forex Trading Sessions in EST
MACD – The Momentum Master
MACD, or Moving Average Convergence Divergence, is a two-in-one tool that combines trend following and momentum. It uses two exponential moving averages (typically 12 and 26 periods) and a signal line to generate crossover signals. When the MACD line crosses above the signal line, it often means the momentum is shifting up. A downward crossover signals a shift to bearish momentum.
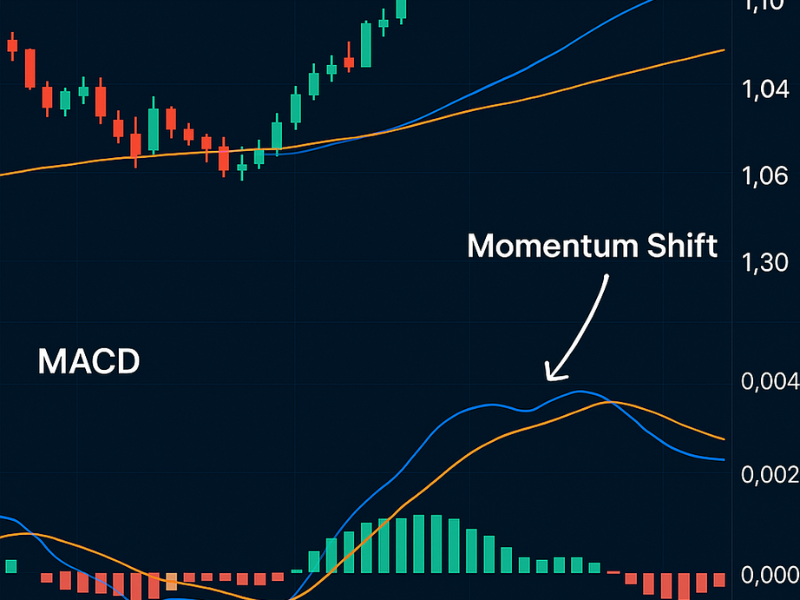
The reason MACD earns a place as the best indicator for forex trading is that it offers both early signals and confirmation. Many traders use MACD histograms to detect momentum shifts before the crossover occurs. Others combine MACD with RSI for a double-confirmation system. This versatility allows MACD to be used in both trending and ranging markets, making it a truly universal trading companion.
Also Read: Xhmaster Formula Forex Indicator
Bollinger Bands – The Volatility Guide
If you want to understand when the market is ready to explode with movement, Bollinger Bands are your answer. This indicator consists of a moving average and two bands plotted at standard deviations above and below it. When the bands contract (a “squeeze”), volatility is low and a breakout may be imminent. When the bands expand, volatility is high—meaning a reversal or cool-down may occur soon.
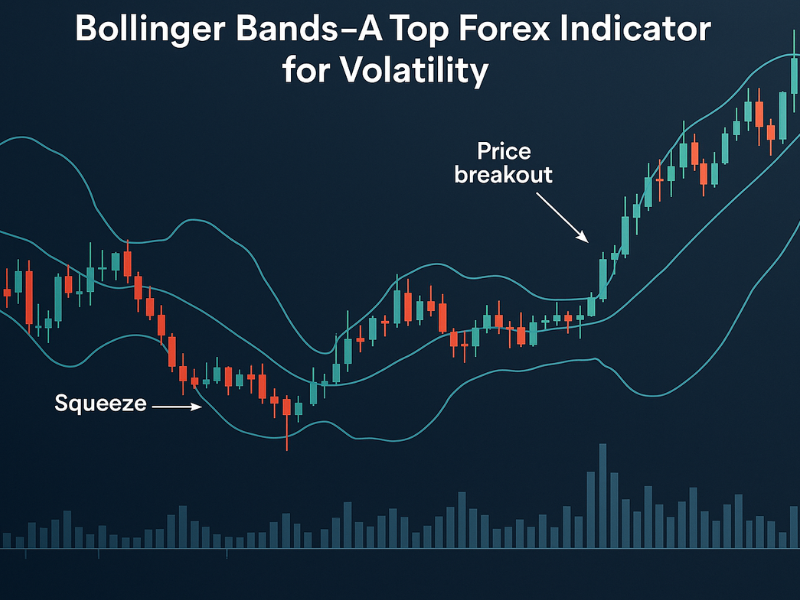
What puts Bollinger Bands on the list of the best indicator for forex trading is its ability to frame price action visually. You can instantly see whether the market is quiet or wild and plan accordingly. Advanced traders often use Bollinger Bands to “fade” the price when it touches the upper or lower band—assuming it will return to the mean. It’s an excellent tool for breakout and reversal strategies, especially when combined with volume or candlestick patterns.
Also Read: Top Firms That Invest Into New Cryptocurrency
Fibonacci Retracement – The Predictive Tool
Unlike the others, Fibonacci Retracement isn’t based on moving averages or momentum but on ratios derived from nature and math. It’s used to predict potential retracement levels in trending markets. After a big price move, traders apply the Fibonacci tool to find levels where price might pause or reverse—commonly at 23.6%, 38.2%, 50%, and 61.8%.
Its ability to identify invisible levels of support and resistance makes Fibonacci Retracement a strong candidate for the best indicator for forex trading. Many traders use it to set profit targets or stop-loss levels, giving them an edge in planning risk-reward ratios. When a Fibonacci level overlaps with another indicator like an MA or a key pivot zone, it becomes even more significant. It’s not just predictive—it’s strategic.
Also Read: How to Accept Cryptocurrency Through Stripe
FAQs
Can I use just one indicator for forex trading?
Yes, but combining two complementary indicators usually provides more reliable signals.
Which indicator is best for beginners?
Moving Averages and RSI are often considered the best for beginners due to their simplicity and effectiveness.
Which indicator is best for identifying reversals?
RSI and MACD are great for spotting potential market reversals, especially when used together.

