When you step into the world of forex trading, one of the first things you’ll realize is this: price doesn’t move randomly. Behind every movement is a story told by numbers, patterns, and momentum. To decode this story, traders rely on the best technical indicators for forex. These tools help you cut through the noise and make smarter decisions instead of trading blindly.
If you’ve ever felt overwhelmed staring at candlestick charts, don’t worry—you’re not alone. In this guide, we’ll walk through the most powerful forex indicators, explain how they work in plain English, and show you how to actually use them without getting lost in technical jargon.
Why the Best Technical Indicators for Forex Traders Matter
Think of forex as a massive ocean. The waves represent price movement, and the indicators are your compass, map, and weather forecast combined. Without them, you’re just sailing blindly, hoping to land somewhere profitable.
Technical indicators make sense of the chaos by highlighting trends, momentum, and possible reversal points. Instead of reacting to every price jump, you learn to anticipate moves with confidence. This edge can mean the difference between being consistently profitable and constantly guessing.
Keypoint: Indicators don’t guarantee success—but they do give structure to your strategy and reduce emotional trading.
Also Read: Best Cryptocurrency to Invest Today
Moving Averages: The Most Trusted Forex Indicator for Trends
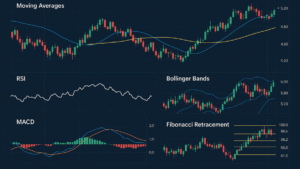
One of the simplest yet most powerful tools is the Moving Average (MA). As the name suggests, it smooths out price data by showing the average closing price over a chosen time period. This gives you a clear picture of the overall direction.
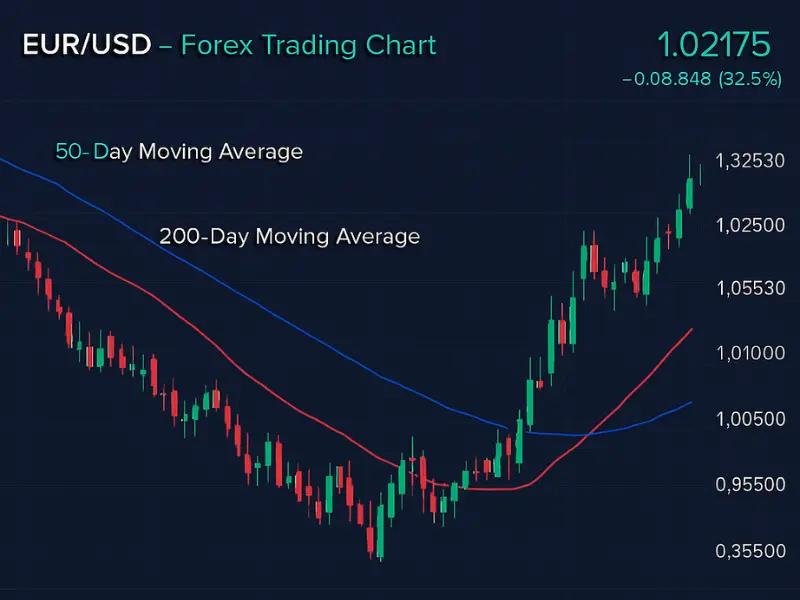
There are two types:
- Simple Moving Average (SMA): calculates the straightforward average.
- Exponential Moving Average (EMA): gives more weight to recent prices, making it more responsive.
Traders often use two moving averages together (like the 50-day and 200-day). When the shorter one crosses above the longer one, it’s a bullish signal. When it crosses below, it hints at a bearish trend.
Keypoint: Use moving averages to avoid being misled by short-term noise and to identify the underlying trend with clarity.
Relative Strength Index (RSI): Spotting Overbought and Oversold Levels
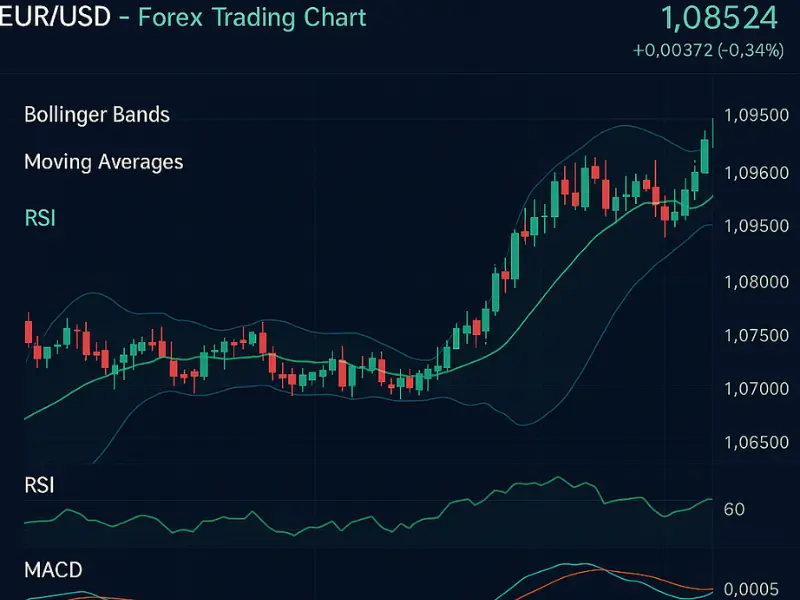
The Relative Strength Index (RSI) is one of the most popular momentum indicators. It tells you whether a currency pair is overbought (too expensive) or oversold (too cheap). The scale runs from 0 to 100, with 70 and above signaling overbought, and 30 and below suggesting oversold.
Imagine you see EUR/USD rising non-stop. Without RSI, you might jump in and buy, only to face a sudden reversal. RSI saves you from this by flashing a warning when the price is stretched too far in one direction.
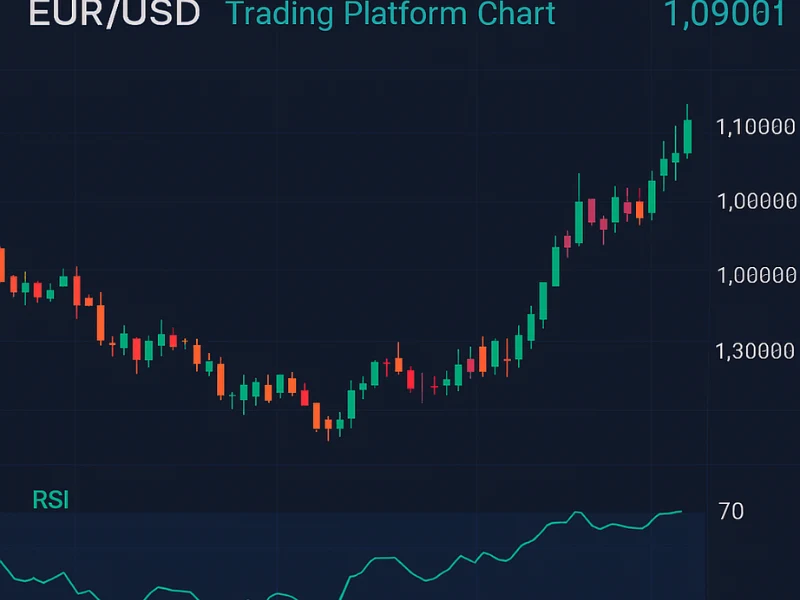
Beyond just overbought and oversold signals, RSI also reveals divergence—when price makes new highs but RSI doesn’t follow, hinting at a weakening trend.
Keypoint: RSI helps traders avoid chasing bad entries and improves timing for both buying and selling decisions.
Bollinger Bands: A Forex Indicator for Reading Volatility and Breakouts
Price doesn’t move in a straight line—it expands and contracts like breathing. That’s where Bollinger Bands shine. They consist of three lines: a middle band (usually a 20-day moving average) and two outer bands that measure volatility.
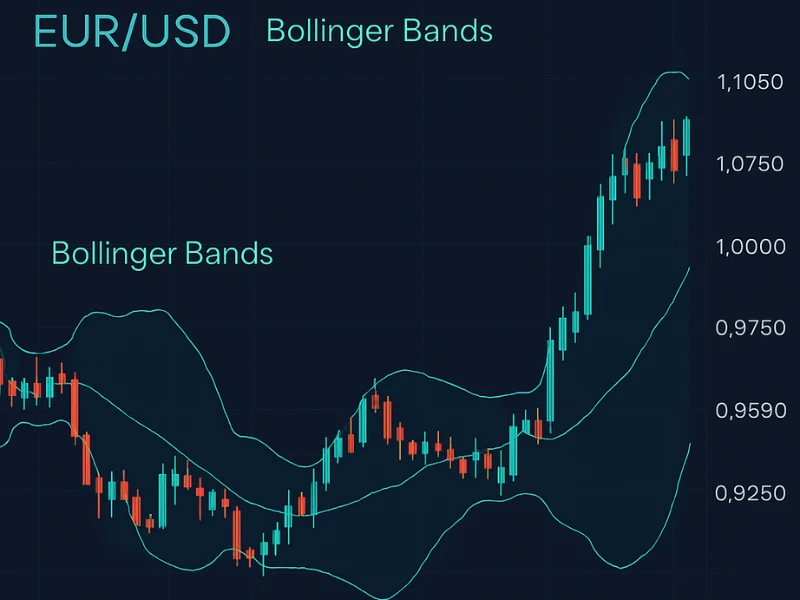
When the bands squeeze tightly, it suggests a breakout may be coming. When they widen, it shows increased volatility and potential exhaustion. Many traders use Bollinger Bands to ride breakout opportunities or confirm overbought/oversold conditions when price touches the outer bands.
Think of them as a radar that helps you sense whether the market is calm, tense, or about to erupt.
Keypoint: Bollinger Bands are ideal for spotting volatility, possible breakouts, and reversal zones.
Also Read: Forex Trading Sessions in EST
MACD: One of the Best Technical Indicators for Forex Trend and Momentum Confirmation
The MACD is like a multi-tool—it tracks both trend and momentum. It consists of two moving averages (fast and slow) and a histogram that shows the difference between them.
When the MACD line crosses above the signal line, it often indicates bullish momentum. When it drops below, it suggests bearish momentum. The histogram bars also reveal the strength of the move, helping you filter weak signals from strong ones.
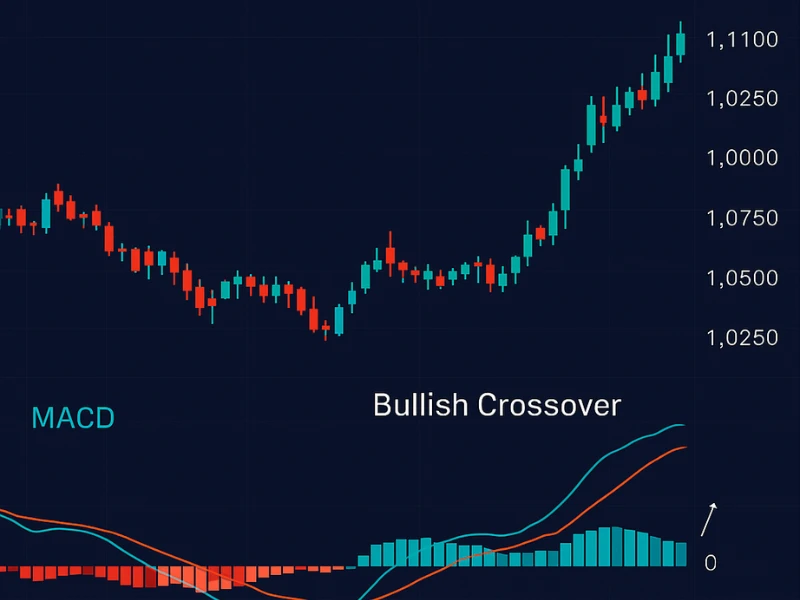
MACD works best when combined with other indicators like RSI or moving averages. Together, they create a more reliable trading picture.
Keypoint: Use MACD to confirm trends and avoid false signals when the market moves sideways.
Fibonacci Retracement: A Forex Indicator for Predicting Pullbacks and Reversals
The forex market often moves in waves—up, down, then retracing before continuing. Fibonacci Retracement levels help you identify those pullback zones where price might pause or reverse.
These levels (23.6%, 38.2%, 50%, 61.8%, and 78.6%) act like invisible lines of support and resistance. Traders plot them from swing high to swing low, and often, price reacts at these exact levels like clockwork.
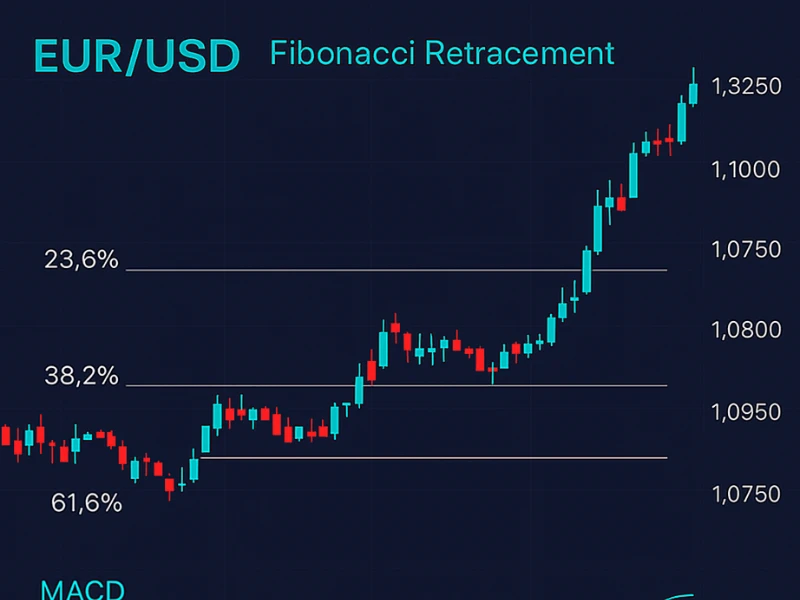
While Fibonacci is not flawless, when combined with trend analysis and momentum indicators, it becomes a powerful weapon in your trading arsenal.
Keypoint: Fibonacci helps you pinpoint entry and exit zones with greater accuracy.
Also Read: Xhmaster Formula Forex Indicator
Combining the Best Technical Indicators for Forex into a Winning Strategy
Here’s the truth: no single indicator is the “holy grail.” The best results come from combining a few that complement each other. For example, you might use:
- Moving Averages to define the trend.
- RSI to check if the market is overbought/oversold.
- MACD to confirm momentum.
This layered approach reduces risk and increases confidence. The secret isn’t loading your chart with 10 indicators—it’s choosing 2–3 that work in harmony with your trading style.
Keypoint: Mastery comes from practice and simplicity, not complexity.
Also Read: How to Accept Cryptocurrency Through Stripe
FAQs
Which technical indicator is best for beginners in forex?
Moving Averages are the easiest to start with because they clearly show the direction of the trend.
Do indicators work in all market conditions?
Not always. Some indicators work best in trending markets (like moving averages), while others perform better in sideways or volatile conditions (like Bollinger Bands).
Are these indicators free to use?
Yes, all of the indicators mentioned are available for free in most trading platforms like MetaTrader 4/5 or TradingView.

